
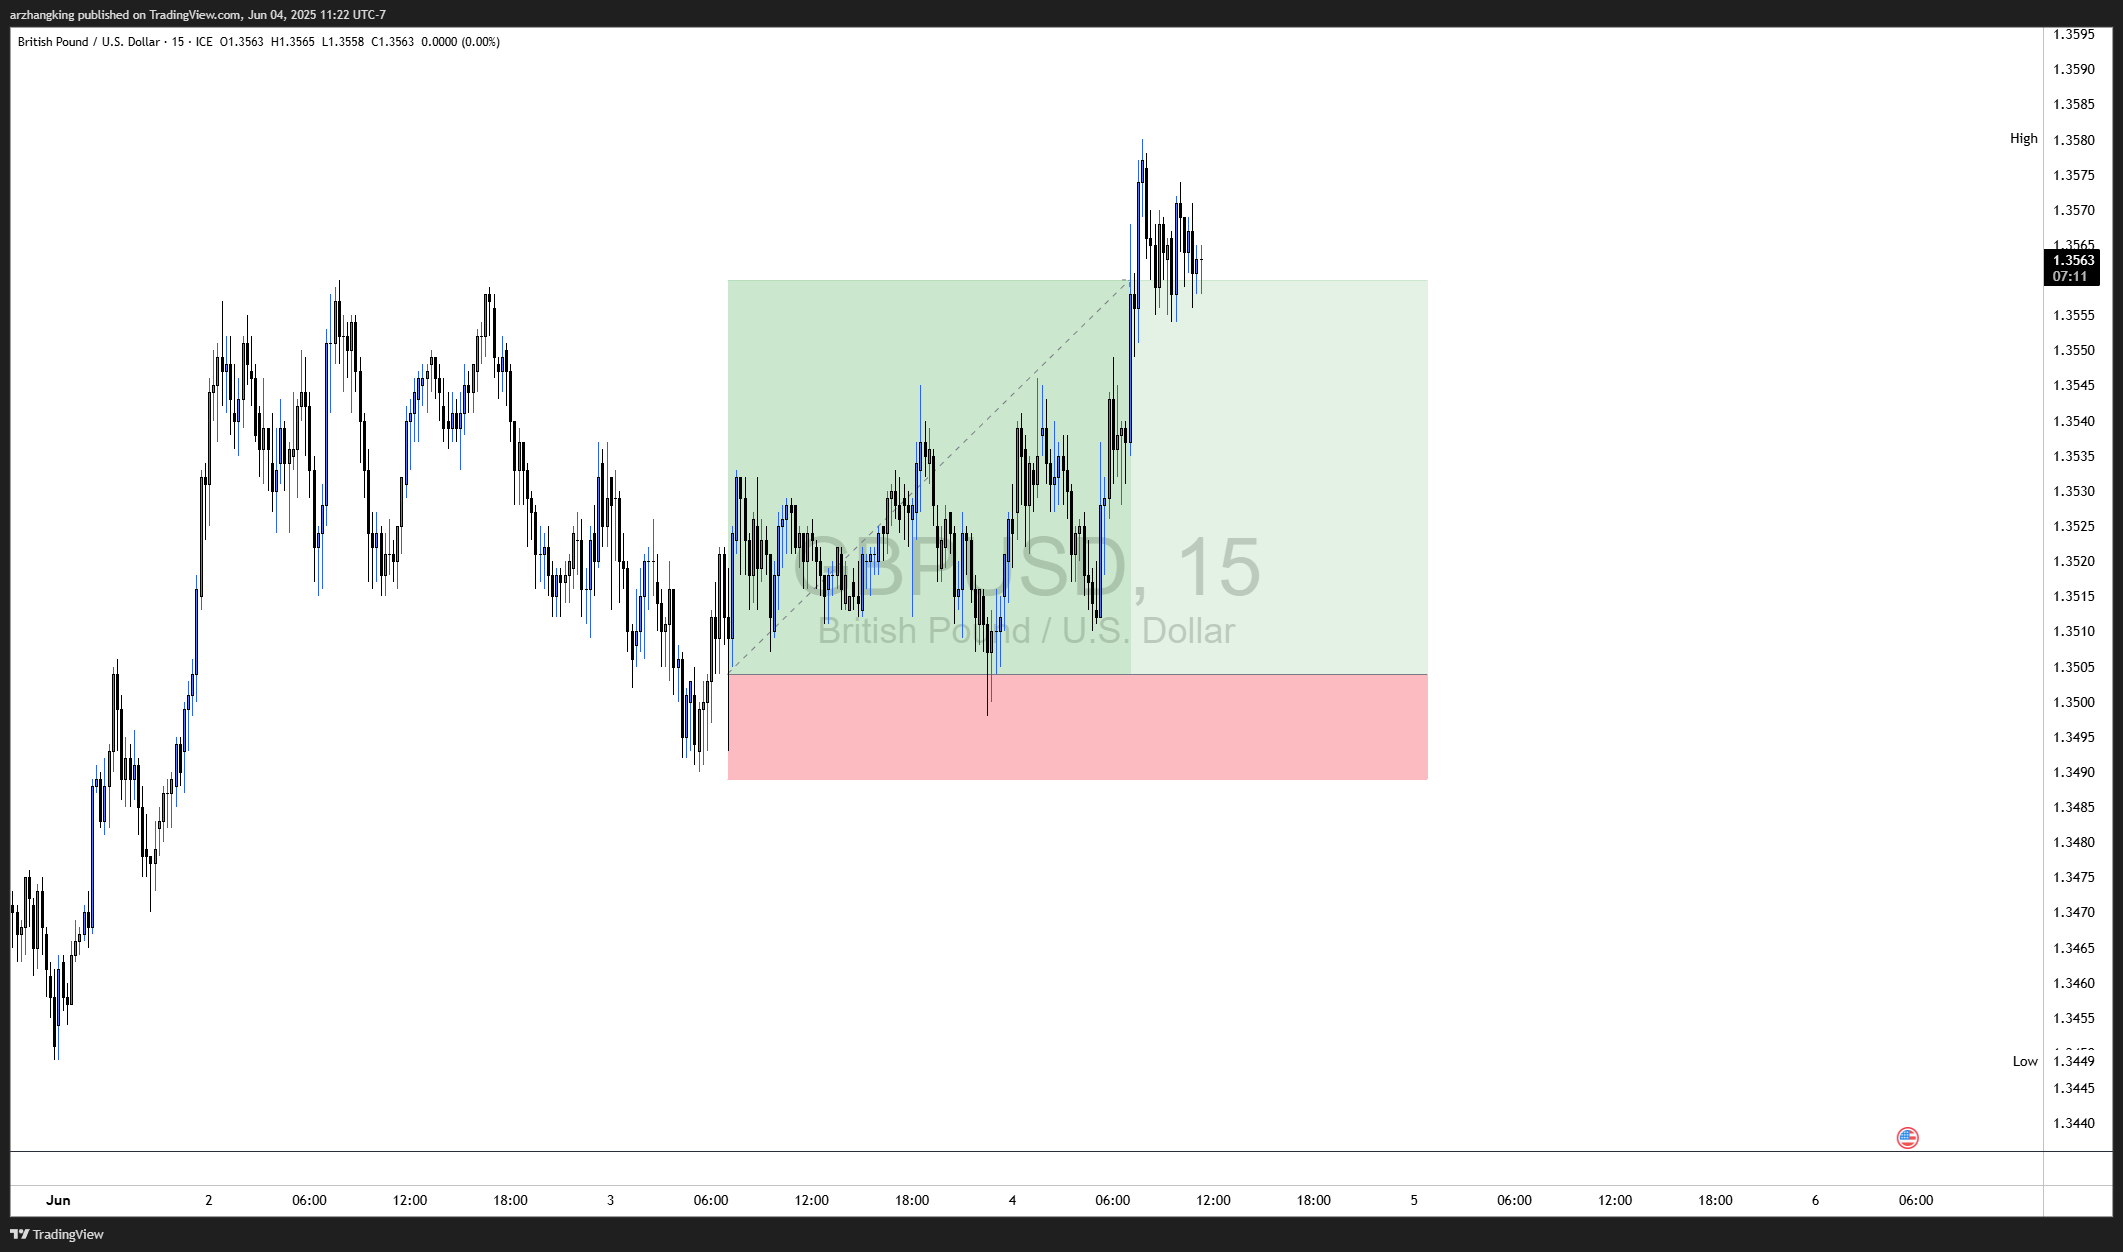
GBP/USD Long Trade Recap – 15-Minute Chart
This was one of our shared trade ideas in the chat, executed with precision based on confluence factors across structure, order flow, and liquidity mapping.
📈 Market Context & Analysis:
Leading into this setup, GBP/USD was forming a series of higher lows, signaling a potential structural reversal after an extended bearish phase. The market began consolidating around a key demand zone with signs of accumulation and diminishing bearish momentum.
-
Entry Zone: Identified after a strong bullish engulfing candle broke short-term structure, confirming a shift in momentum.
-
Confluence:
-
Bullish BOS (Break of Structure) on the 15-minute
-
Price retesting an internal bullish order block
-
Rejection wick confirming demand interest
-
-
Stop Loss: Strategically placed below the protected low and liquidity pool, ensuring invalidation only occurs on confirmed bearish reversal.
-
Take Profit: Positioned just below the major swing high to secure profits before potential resistance or distribution.
✅ Trade Outcome:
-
The trade moved decisively in our favor, reaching the target with minimal drawdown.
-
This execution demonstrated high R:R efficiency, clean price action, and alignment with our intraday bullish bias.
Why This Trade Worked:
-
Patience in waiting for confirmation paid off.
-
Structure + liquidity + reaction from a key zone provided a textbook setup.
-
It aligned with broader market sentiment and timing during active trading hours.
This is a prime example of how following structure and respecting confluence zones can lead to high-probability outcomes. Trade ideas like this continue to be shared and refined live in our chat community.
Disclaimer
Educational example only. Signals are not financial advice; trade at your own risk.